Data Science2025
Time Series Forecasting — Battle Royale
Exploration and benchmark of deep learning models for sales forecasting: LSTM from scratch vs Nixtla NeuralForecast (MLP, NHITS).
PyTorchLSTMTime SeriesNeuralForecastKaggleDeep LearningPythonPandas
Context & Dataset
Project exploring deep learning architectures for time series forecasting, based on the Kaggle dataset "Store Sales — Time Series Forecasting".
Dataset:
• 3 million rows of sales data
• 4.6 years of history (January 2013 – August 2017)
• 54 stores, 33 product families
• Variables: date, store_nbr, family, sales, onpromotion
Notebook focus:
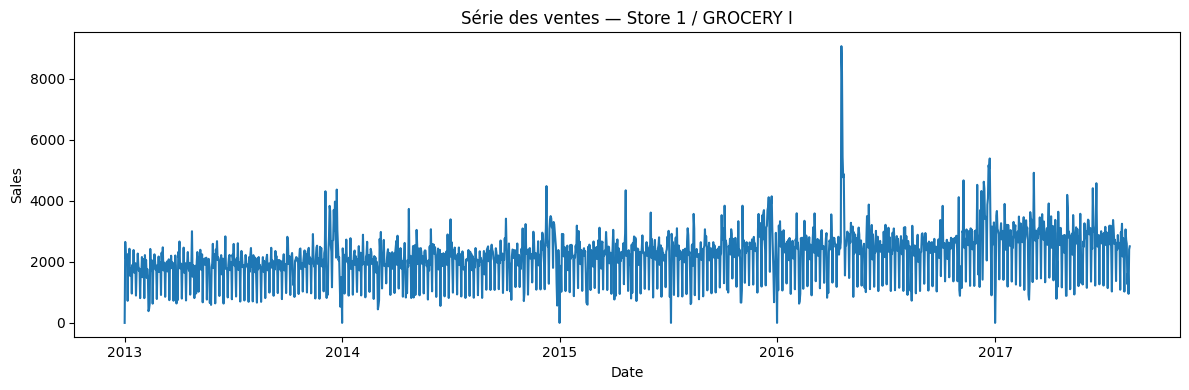
For this benchmark, the focus is on a single time series: Store 1, GROCERY I family, i.e. 1,684 days of data. The goal is to compare architectures without the noise of multi-dimensionality.
Learning objectives:
• Understand LSTM fundamentals by implementing one from scratch
• Compare with industrial frameworks (Nixtla NeuralForecast)
• Assess whether architectural complexity translates into performance
3M
Rows
4.6 years
Period
54
Stores
1,684 days
Focus
1 / 2
Time series visualization: daily sales over 4+ years
LSTM from Scratch (PyTorch)
Manual implementation of an LSTM in PyTorch to understand the model's internal mechanisms.
Implemented architecture:
• Input: 30-day sequence (lookback window)
• LSTM: 1 layer with 50 hidden units, followed by a linear layer
• Output: next-day prediction
• Loss: MSE (Mean Squared Error)
• Optimizer: Adam with a learning rate of 0.001
Preprocessing:
• Min-Max normalization of sales
• Creation of sliding sequences (sliding window)
• Test set: the last 14 days of the series (forecast horizon)
LSTM intuition:
The LSTM (Long Short-Term Memory) uses gates (forget, input, output) to control the flow of information. Unlike classic RNNs, it can capture long-term dependencies thanks to its memory cell.
Result: MAE 452.2, RMSE 593.9
The manual implementation serves as a baseline to evaluate the optimized frameworks.
30 days
Lookback
50 units
Hidden
452.2
MAE
593.9
RMSE
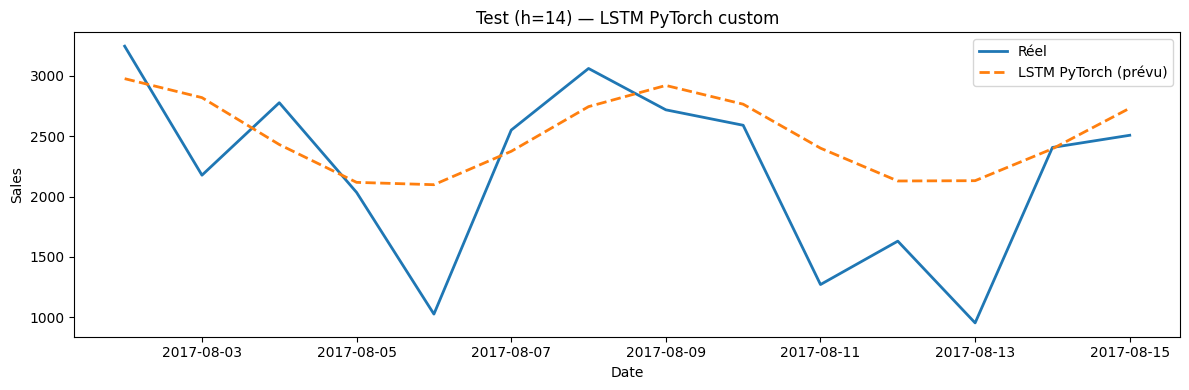
LSTM from scratch: predictions vs actuals on the test set
Nixtla NeuralForecast
Comparison with three models from Nixtla's NeuralForecast library, an industrial forecasting framework.
Evaluated models:
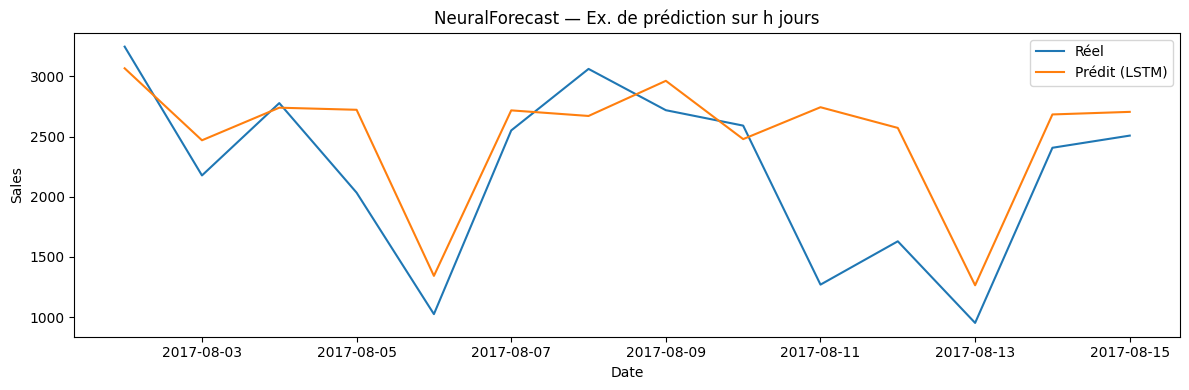
1. LSTM (Nixtla) — NeuralForecast implementation (LSTM encoder + MLP decoder), with the same 30-day window. Result: MAE 402.3, RMSE 549.0
2. MLP (Multi-Layer Perceptron) — Simple architecture: dense layers without temporal memory. The model learns positional patterns (day of the week, etc.) rather than sequential ones. Result: MAE 356.8, RMSE 504.7
3. NHITS (Neural Hierarchical Interpolation for Time Series) — State-of-the-art architecture with multi-scale sampling and hierarchical interpolation. Designed to capture patterns at different granularities. Result: MAE 404.8, RMSE 526.4
Key observation:
Despite its simplicity, the MLP beats the sophisticated architectures. This suggests that sales follow positional patterns (day of the week, end of month) more than sequential dependencies.
MAE 402.3
LSTM Nixtla
MAE 356.8
MLP
MAE 404.8
NHITS
MLP
Best
1 / 2
LSTM Nixtla: better calibration than the custom implementation
Battle Royale — Results
Final comparison of the 4 models on the MAE and RMSE metrics, measured on the last 14 days of the series.
Ranking by RMSE (MAE change versus the baseline in parentheses):
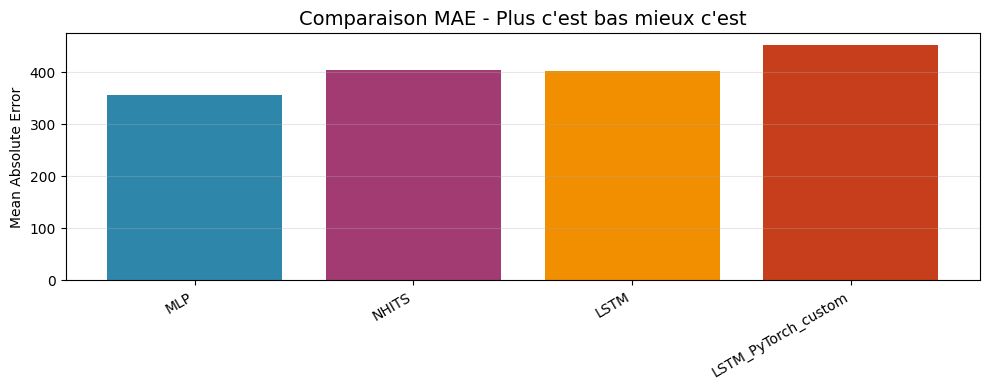
1st — MLP: MAE 356.8, RMSE 504.7 (MAE -21.1%)
2nd — NHITS: MAE 404.8, RMSE 526.4 (MAE -10.5%)
3rd — LSTM Nixtla: MAE 402.3, RMSE 549.0 (MAE -11.0%)
4th — Custom LSTM: MAE 452.2, RMSE 593.9 (baseline)
On MAE alone, LSTM Nixtla slightly outperforms NHITS (402.3 vs 404.8).
Key insights:
1. Complexity ≠ Performance — The MLP (the simplest) achieves an MAE 11.9% lower than NHITS (the most sophisticated), as well as a better RMSE. Architectural complexity does not always pay off.
2. Nature of the patterns — Sales follow positional patterns (which day of the week) rather than sequential ones (what happened yesterday). The MLP captures these patterns better.
3. Framework vs Custom — All three NeuralForecast models achieve a lower MAE and RMSE than the manual implementation.
Recommendation: For this kind of retail data, start with an MLP before investing in complex architectures.
MLP
Winner
+21.1%
MAE gain
Simple > Complex
Insight
Positional
Pattern
1 / 2
MAE by model: the MLP (356.8) leads the ranking